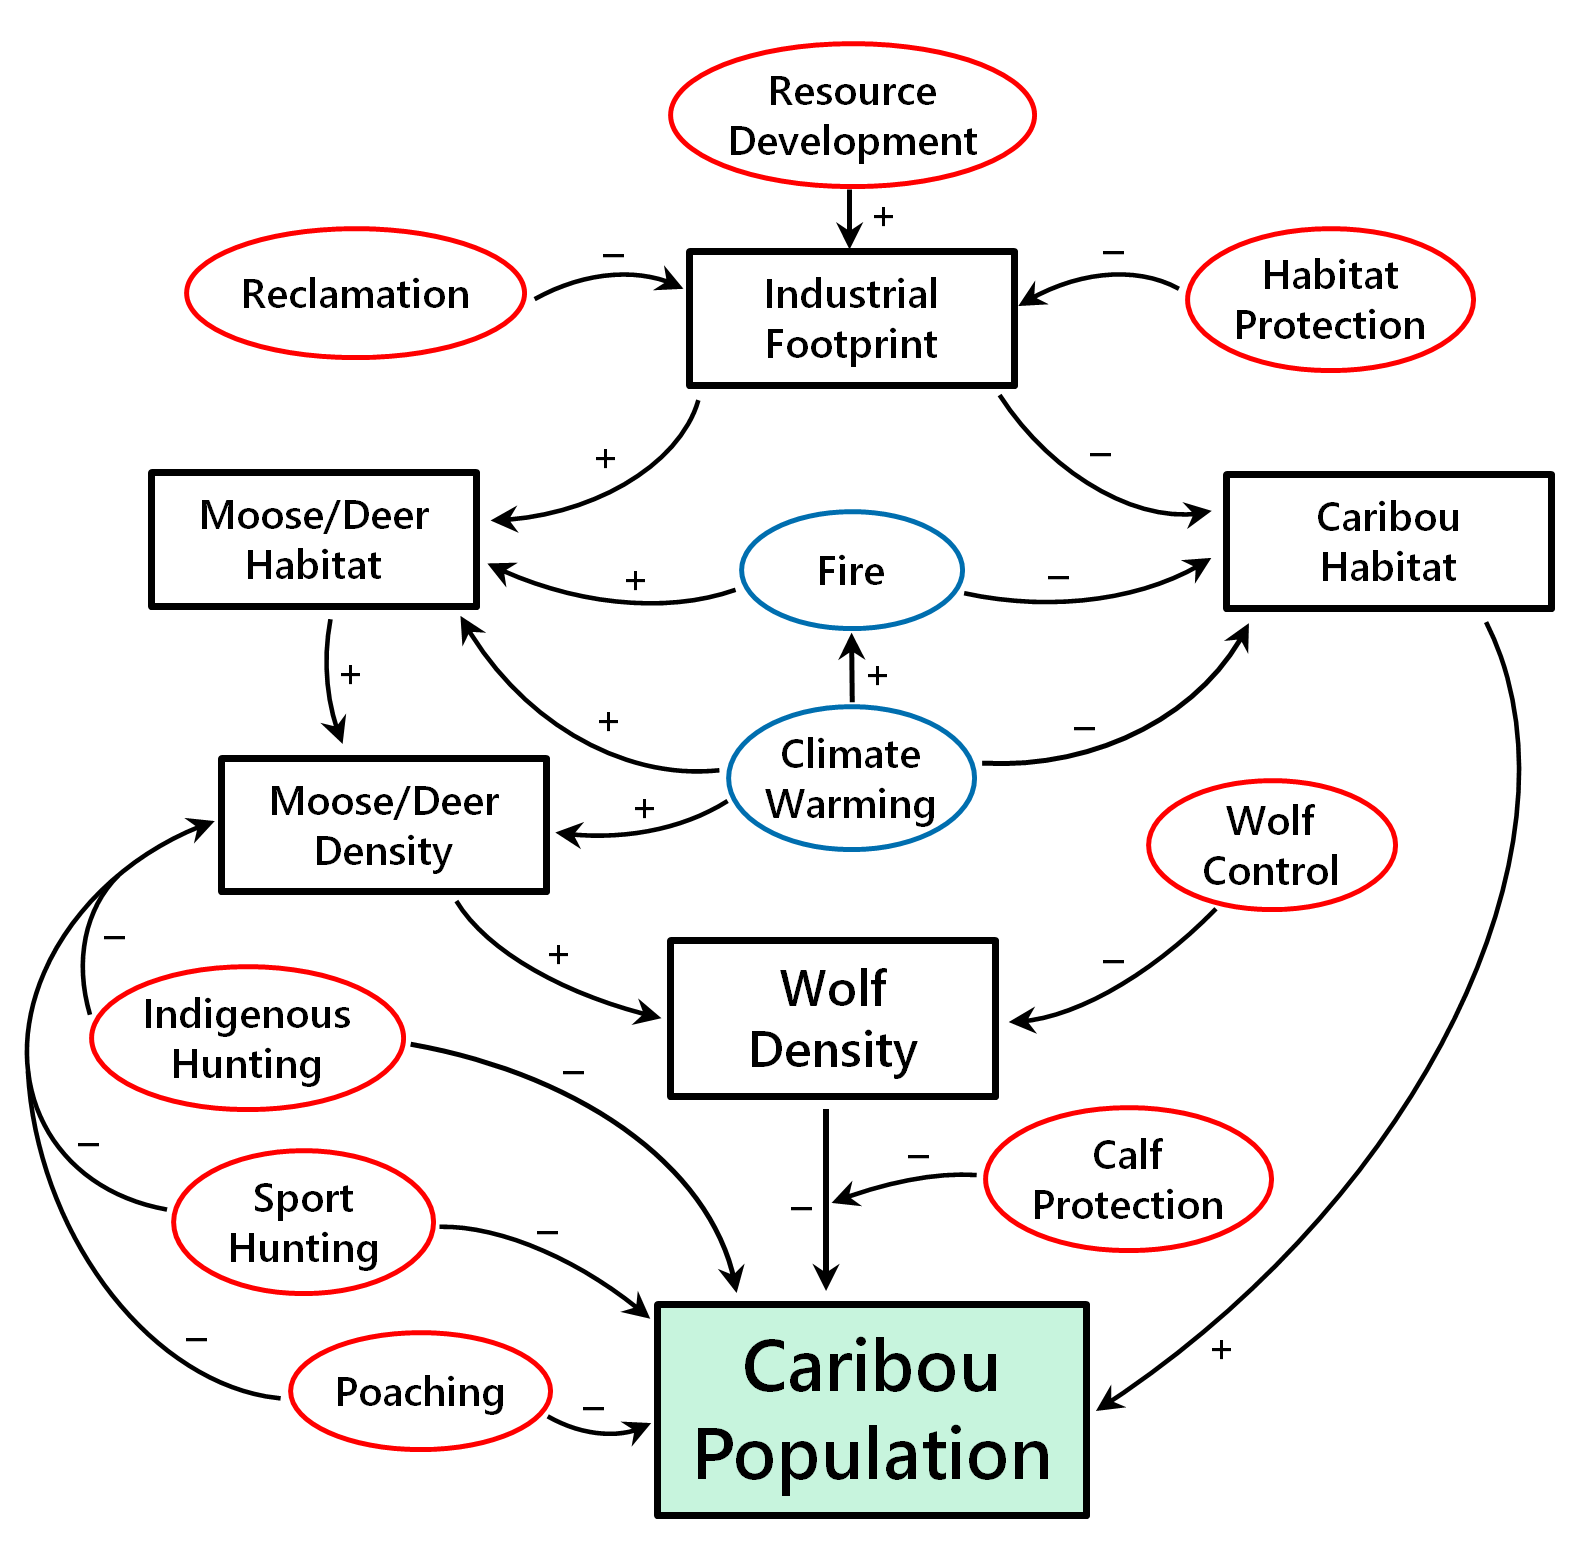
Fig. 10.4. A conceptual model illustrating the effects of management actions on woodland caribou populations. Stock variables are shown in black squares, flow variables for management actions are shown in red ovals, and external flow variables are shown in blue ovals. Internal flow variables are shown as arrows, with plus and minus signs indicating a net positive or negative relationship. This model is a synthesis based largely on federal and provincial caribou recovery plans
