Fig. 10.8. The performance of all 28 management alternatives in the whooping crane example. The Score is as described in Table 10.2.
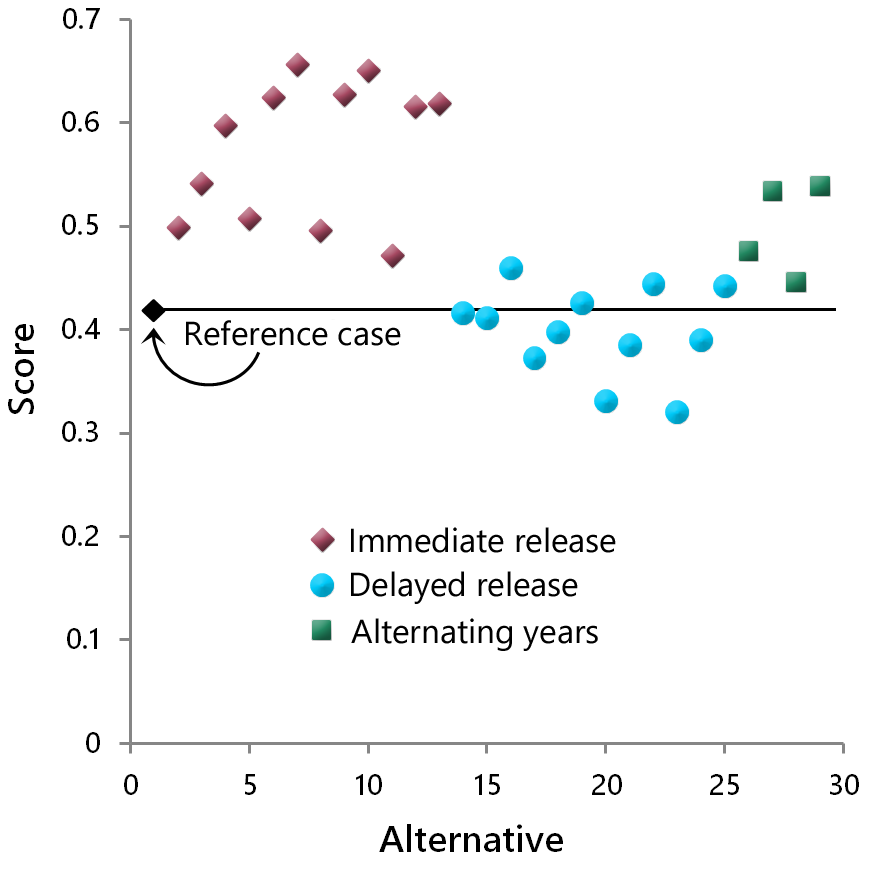
Fig. 10.8. The performance of all 28 management alternatives in the whooping crane example. The Score is as described in Table 10.2.
Canadian Centre for Translational Ecology. 2019 © Creative Commons Attribution ShareAlike License 4.0