Fig. 11.30. A map overlay illustrating the limited overlap between caribou ranges (light blue) and the planning units selected in the base scenario with fine-filter elements added.
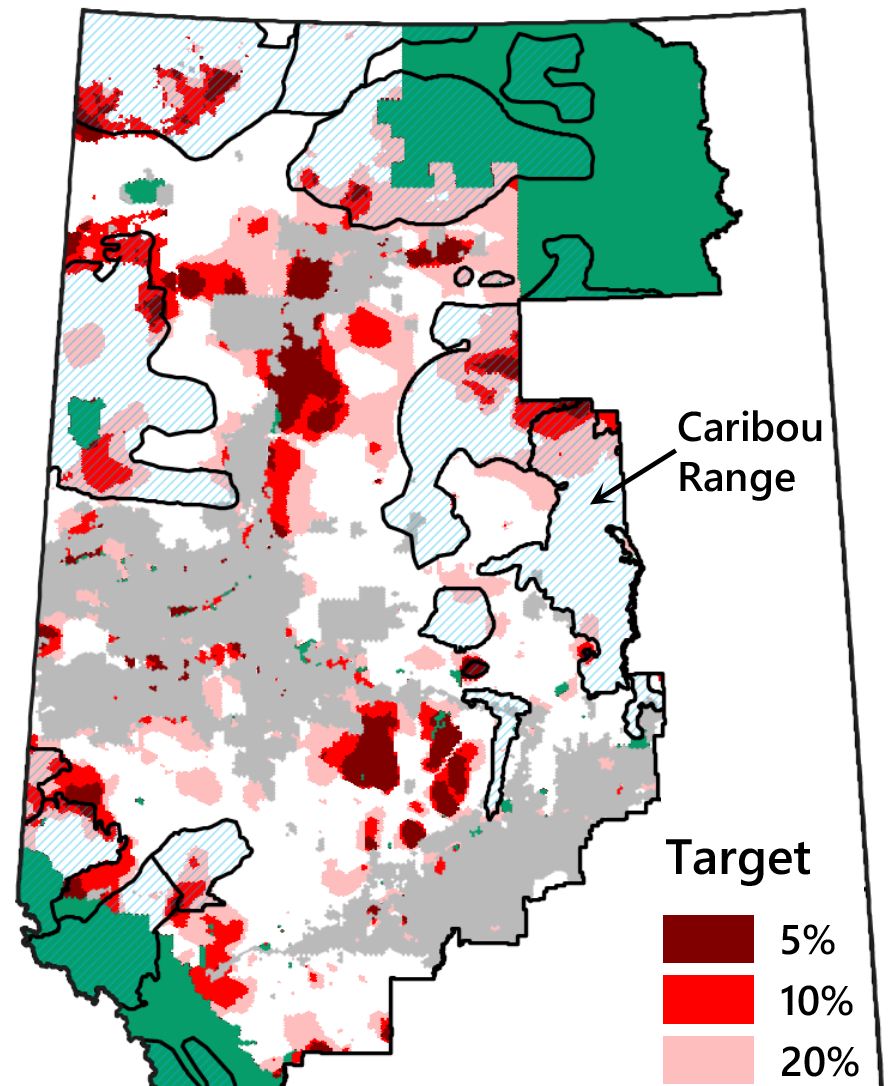
Fig. 11.30. A map overlay illustrating the limited overlap between caribou ranges (light blue) and the planning units selected in the base scenario with fine-filter elements added.
Canadian Centre for Translational Ecology. 2019 © Creative Commons Attribution ShareAlike License 4.0