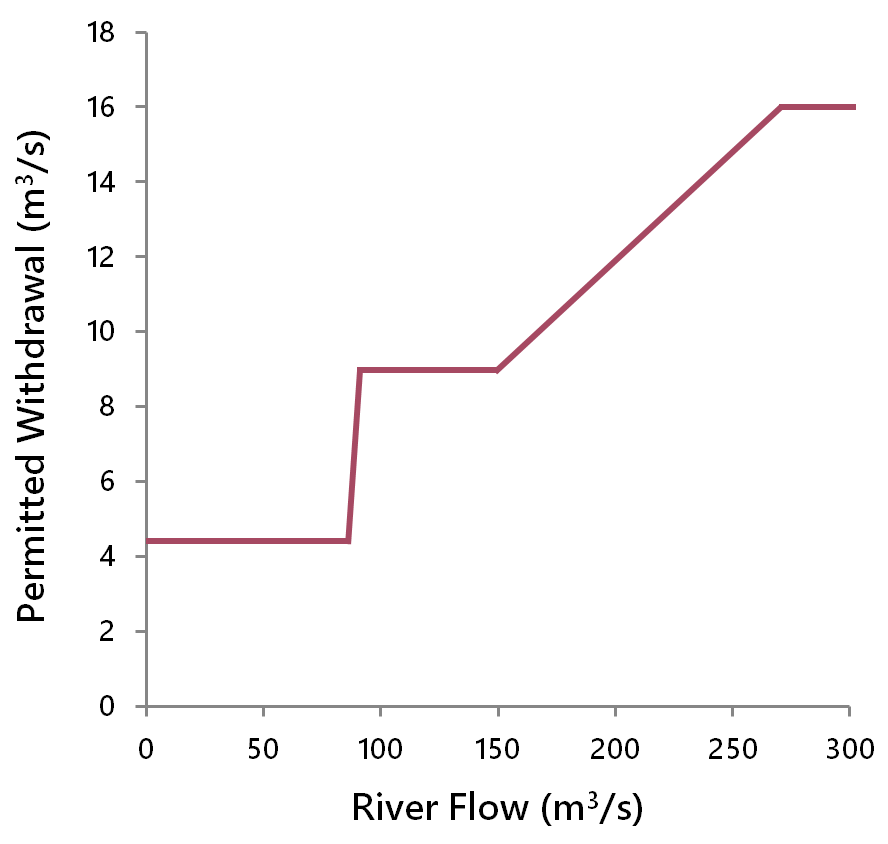
Fig. 11.8. Under the Surface Water Quantity Management Framework, water withdrawal limits are linked to the flow rate of the Athabasca River. The limits shown here are for Jan. 1 to Apr. 15. The limits in other periods are variations on this pattern. Adapted from GOA 2015.