Fig. 2.4. The distribution of human access in 2013, based on Landsat imagery. Source: Global Forest Watch Canada
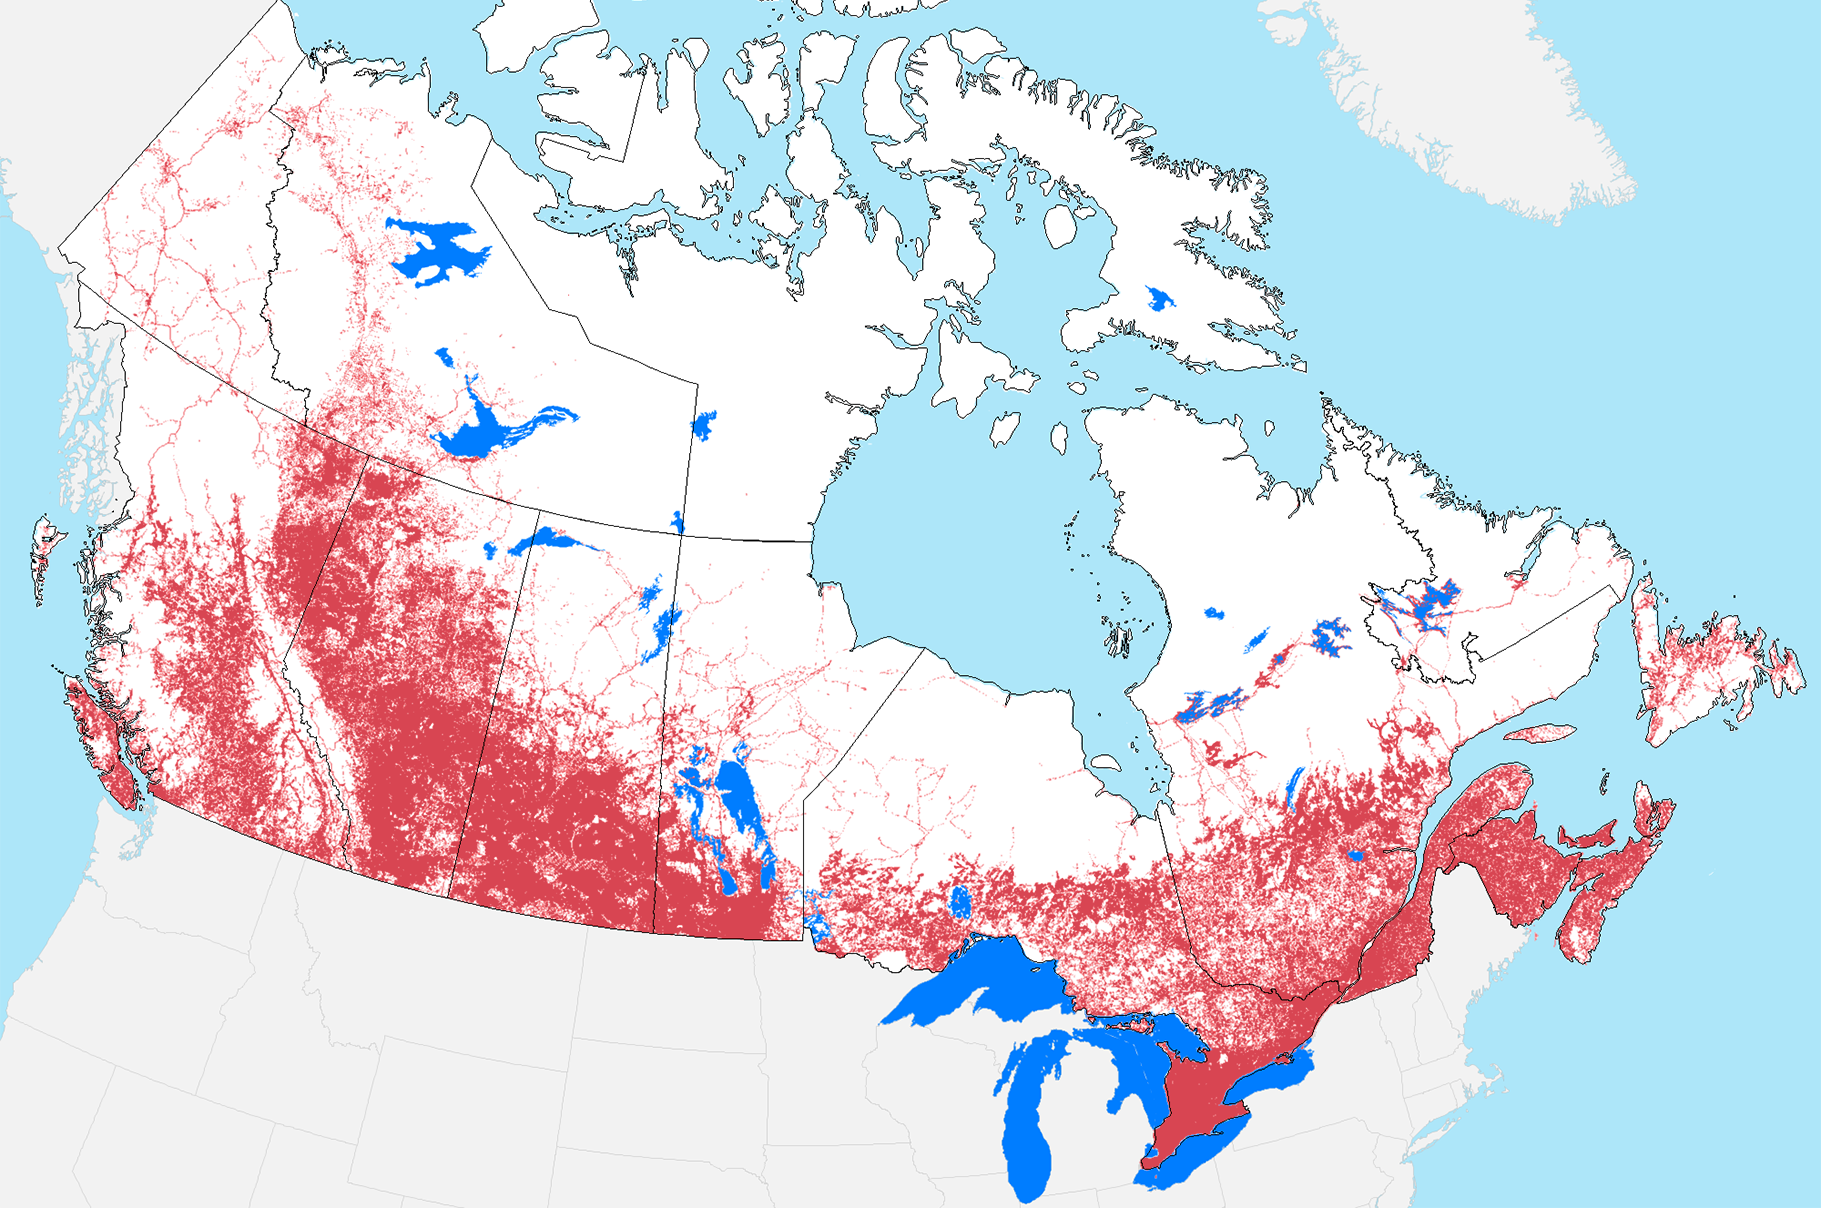
Fig. 2.4. The distribution of human access in 2013, based on Landsat imagery. Source: Global Forest Watch Canada
Canadian Centre for Translational Ecology. 2019 © Creative Commons Attribution ShareAlike License 4.0