Fig. 6.4. An illustration of how the birth and death rate functions from Fig. 6.1 (dotted lines) might change as a result of anthropogenic disturbance (solid lines).
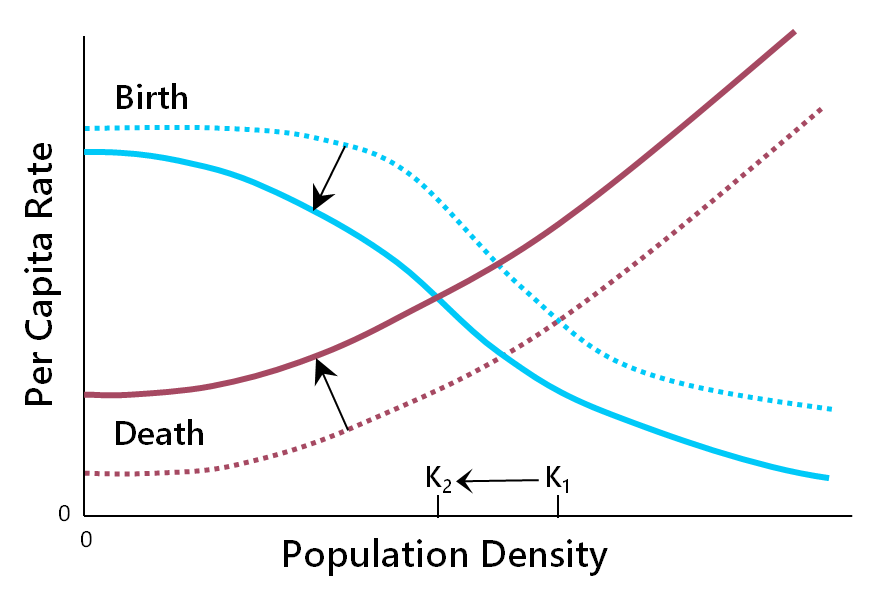
Fig. 6.4. An illustration of how the birth and death rate functions from Fig. 6.1 (dotted lines) might change as a result of anthropogenic disturbance (solid lines).
Canadian Centre for Translational Ecology. 2019 © Creative Commons Attribution ShareAlike License 4.0