Fig. 8.7b. An example of the type of output provided by Marxan, adapted from Case Study 6. Map B illustrates the summarized output from 100 model runs. Darker shades of red indicate a higher frequency of selection. Each planning unit is 500 ha.
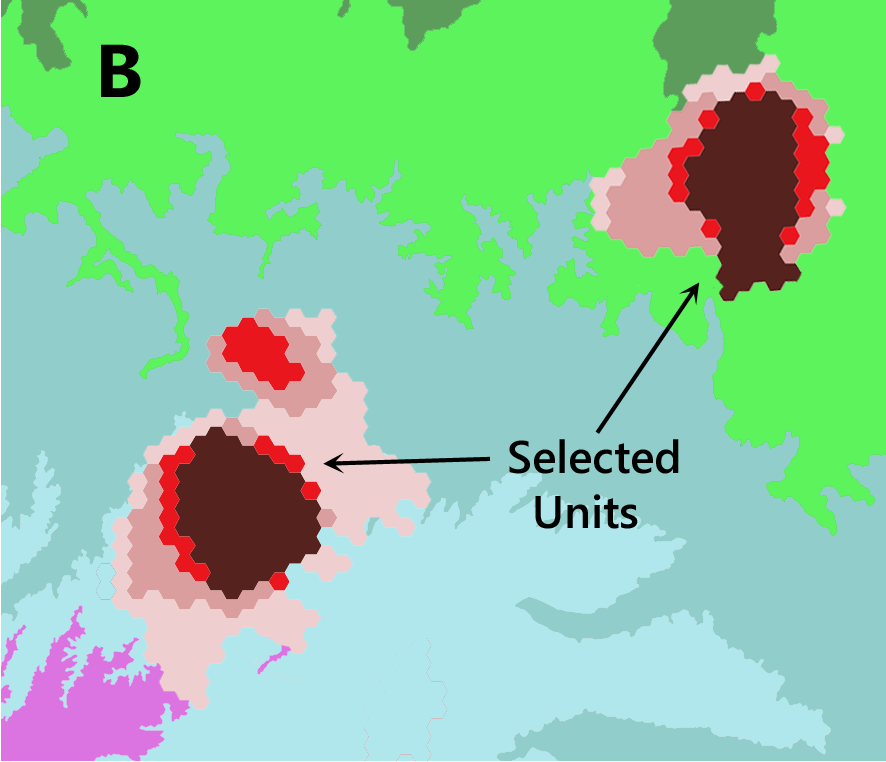
Fig. 8.7b. An example of the type of output provided by Marxan, adapted from Case Study 6. Map B illustrates the summarized output from 100 model runs. Darker shades of red indicate a higher frequency of selection. Each planning unit is 500 ha.
Canadian Centre for Translational Ecology. 2019 © Creative Commons Attribution ShareAlike License 4.0