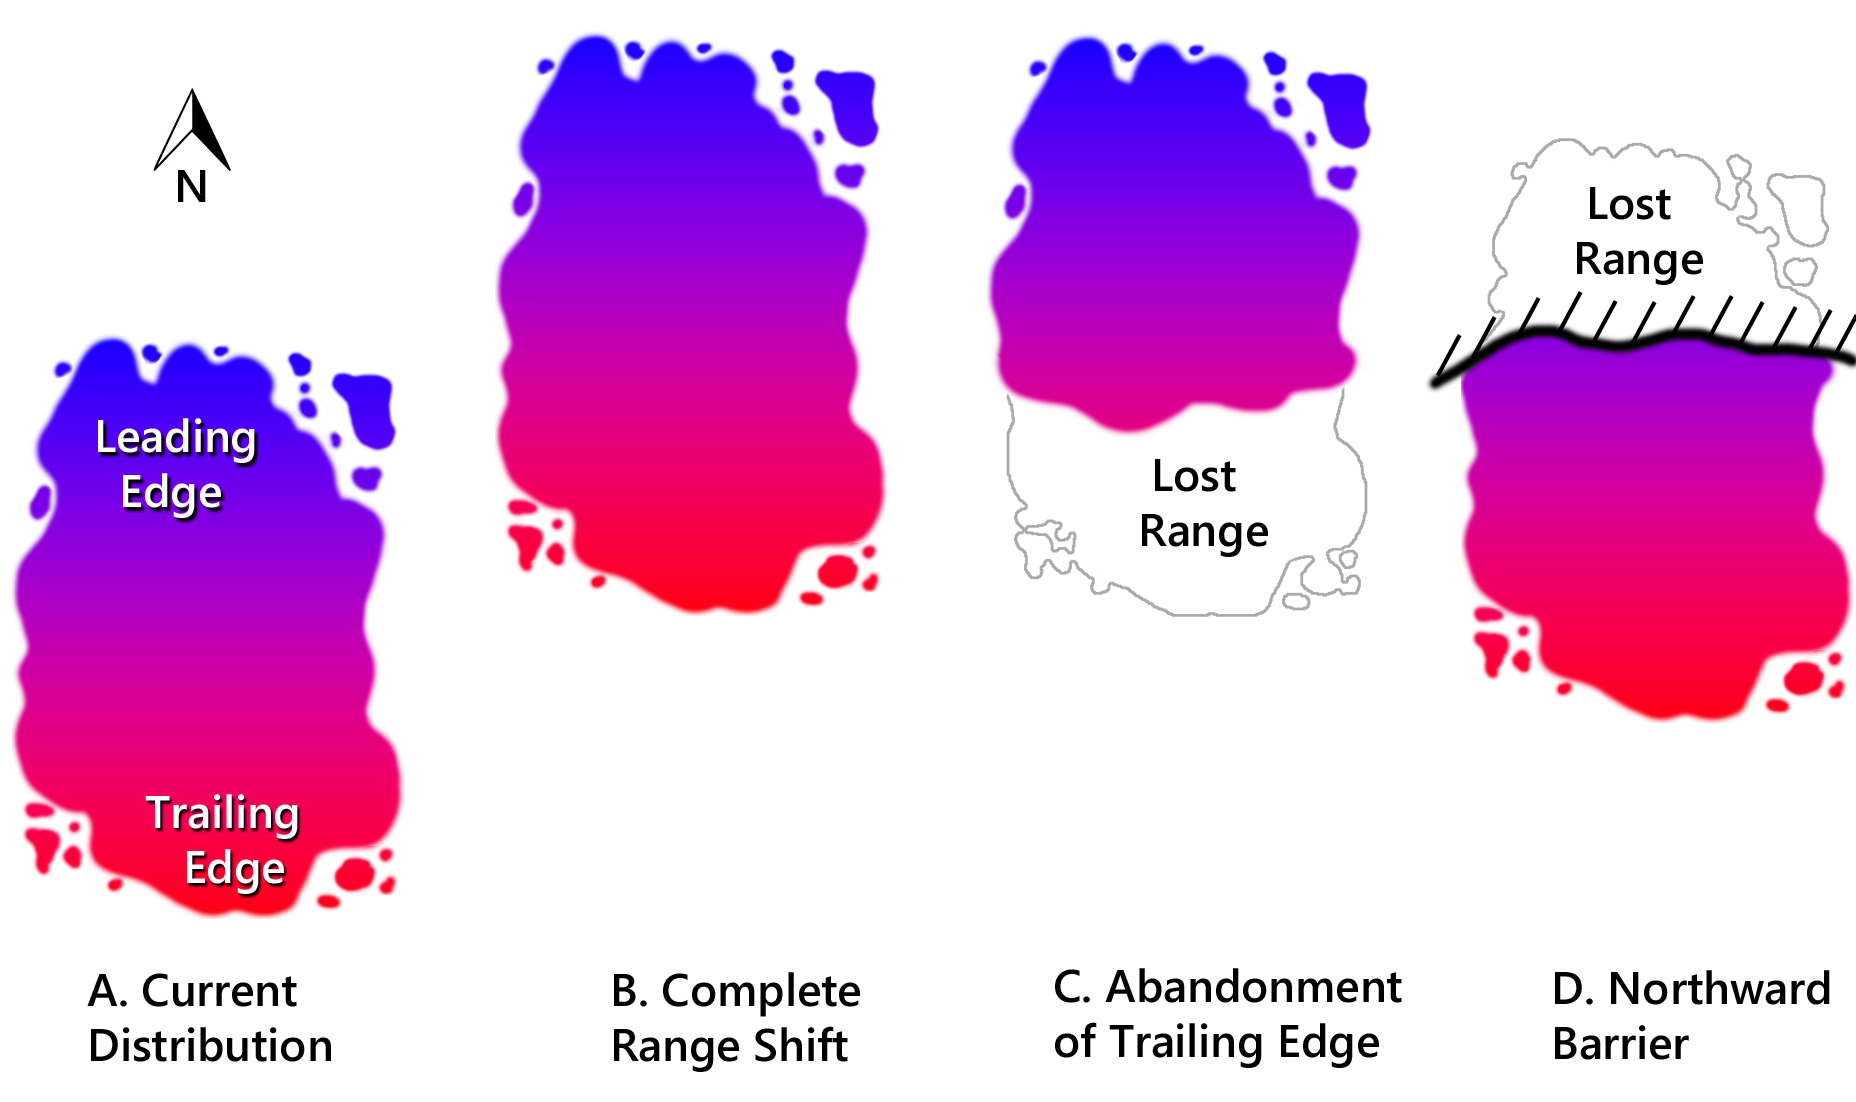
Fig. 9.16. Many species exhibit genetic adaptations to local climatic conditions, illustrated here in a red (warm) to blue (cool) colour spectrum. Panel A represents the current distribution of a hypothetical species. Panel B represents its future distribution under a warmer climate, assuming that the range shift is not impeded and all genetic variation is maintained. Panel C illustrates the future distribution that may arise if trailing-edge populations are allowed to become extirpated. The range has contracted because the gene pool is smaller and cannot accommodate the same spectrum of environmental conditions. Panel D illustrates an alternate scenario, in which a barrier prevents the species from shifting its range northward. The species remains viable because warm-adapted populations replace cool-adapted populations, but the range is compressed.