Fig. 9.2. The global CO2 concentration, 1960–2017. The dashed line indicates the maximum CO2 level recorded over the preceding 800,000 years based on ice-core data. Source: Lüthi et al. 2008; NASA 2018.
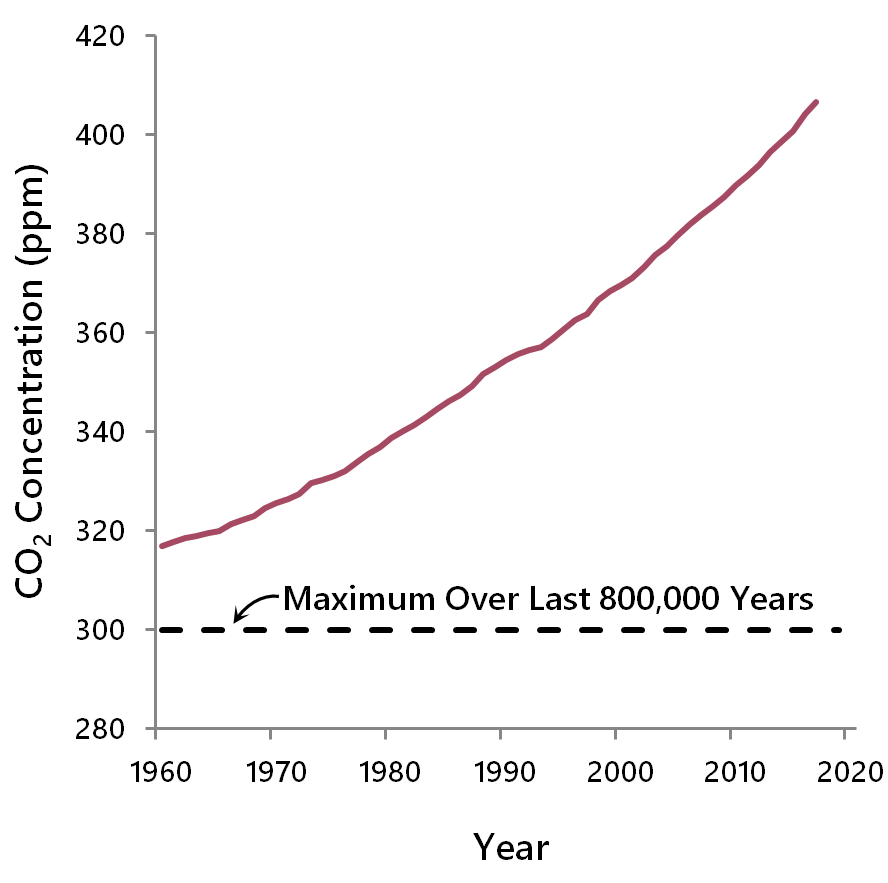
Fig. 9.2. The global CO2 concentration, 1960–2017. The dashed line indicates the maximum CO2 level recorded over the preceding 800,000 years based on ice-core data. Source: Lüthi et al. 2008; NASA 2018.
Canadian Centre for Translational Ecology. 2019 © Creative Commons Attribution ShareAlike License 4.0