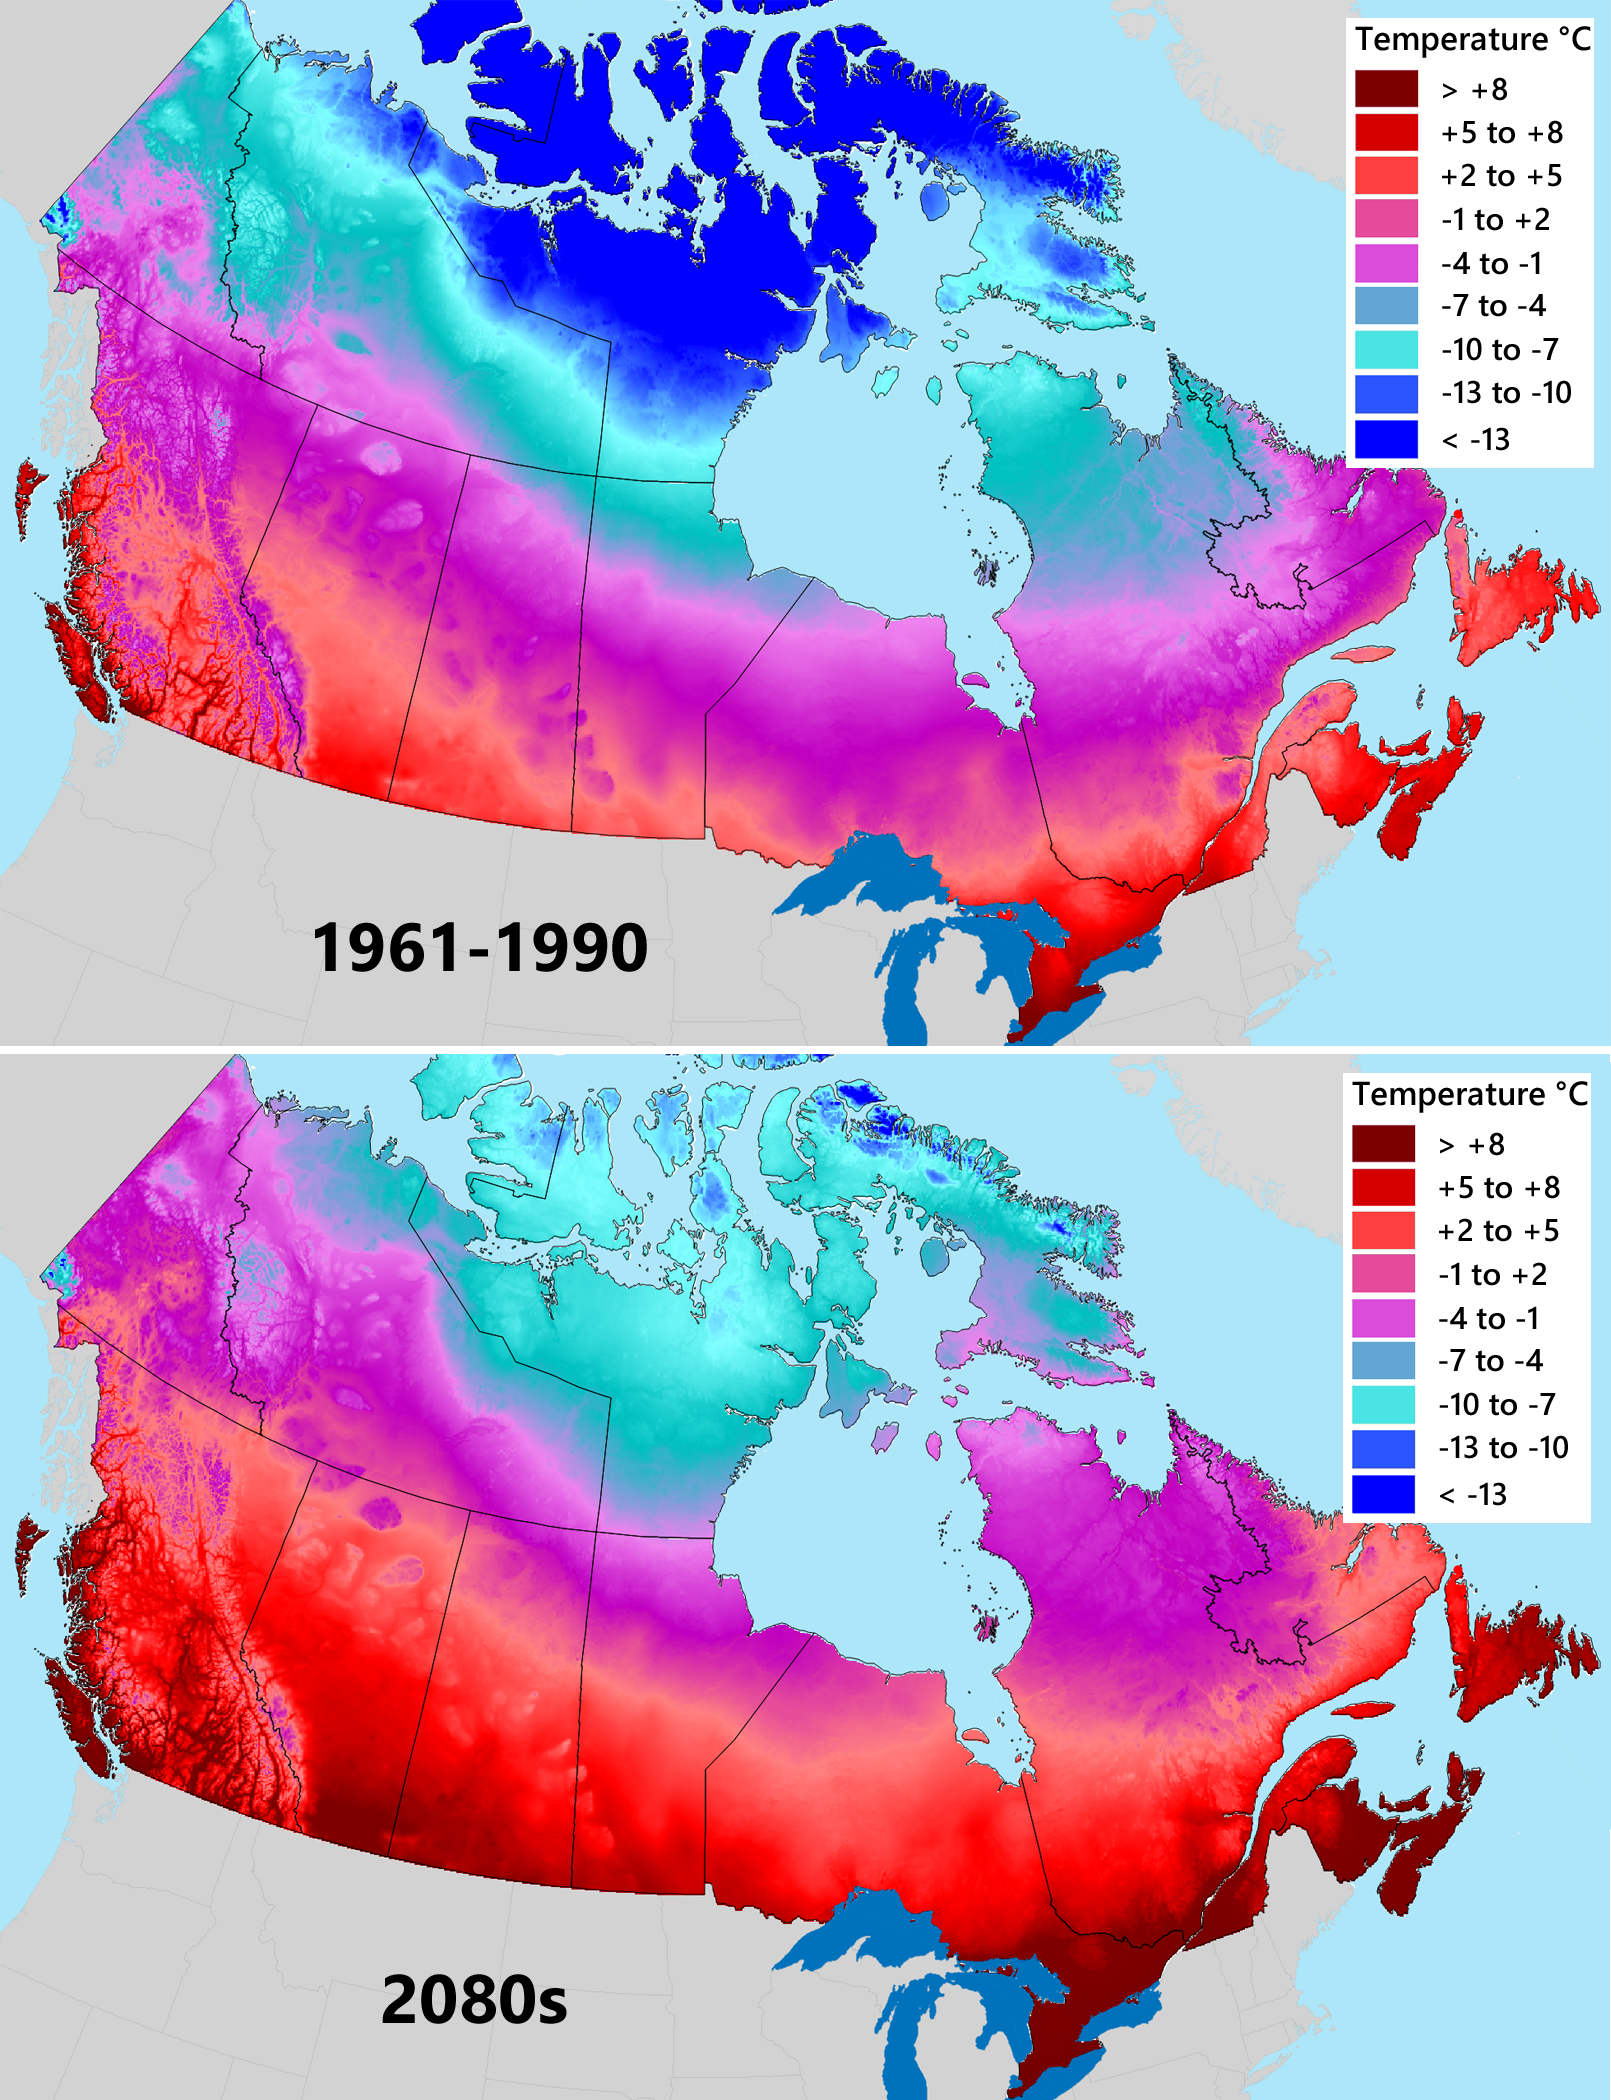
Fig. 9.3. The mean annual temperature in Canada. Top: the 1961–1990 reference period. Bottom: the projected mean annual temperature for the 2080s under the second-lowest emission scenario (RCP 4.5; ensemble mean). Source: ClimateNA interpolation, available at https://adaptwest.databasin.org/pages/adaptwest-climatena.