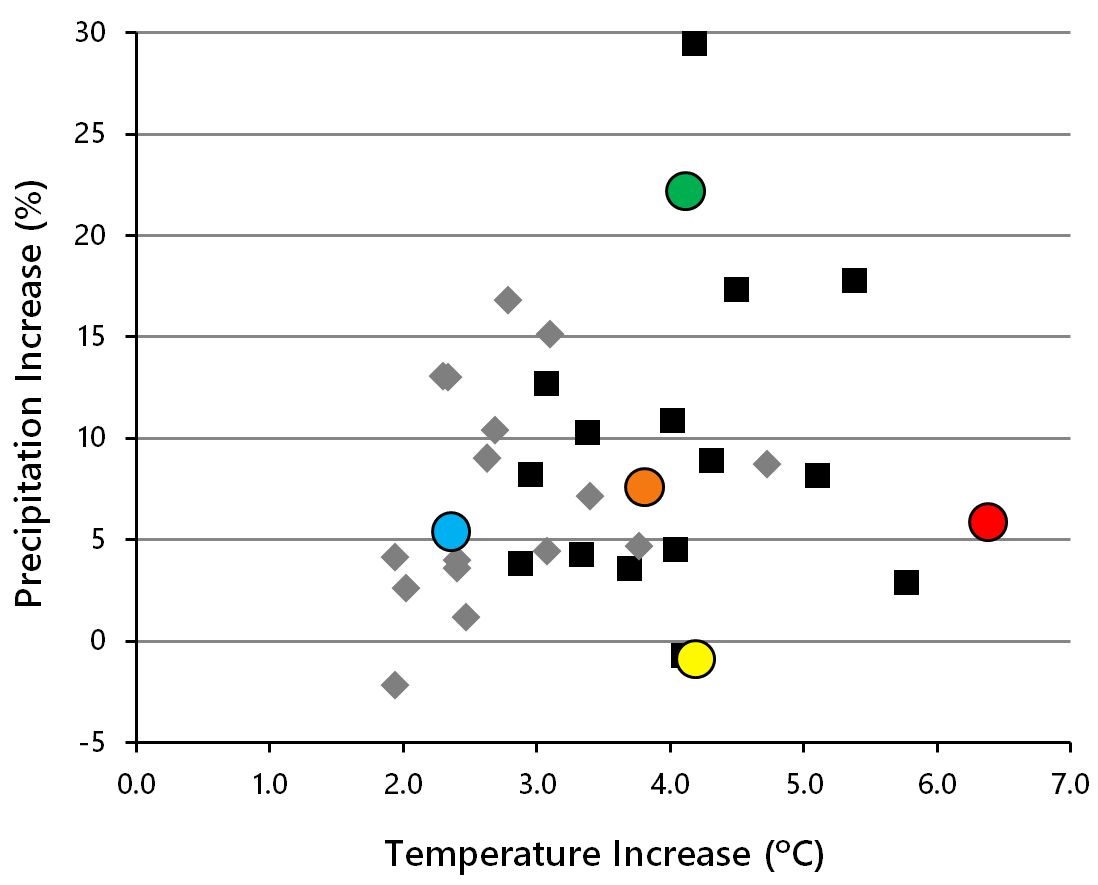
Fig. 9.8. The projected increase in mean annual temperature and precipitation to 2080 for 18 climate models. The grey diamonds represent a low-emission scenario, and the black squares represent a high-emission scenario. The coloured circles are candidate climate scenarios for use in planning applications. Data are for the province of Alberta, adapted from Schneider 2013.